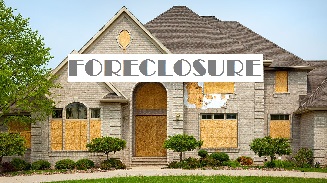
FORECLOSURE STATISTICS IN THE US
Filings, Rates, Home Repossesions
The newest foreclosure statistics reviewed that there were 2.7 Million foreclosure filings in 2011 in America. The Average Foreclosure Sales Price is $183,400.00.

Every 3 months 250 Thousand families enter into foreclosure in the US.
In December of 2011, 1 in every 634 housing units received a foreclosure filing.
It is estimated that 4 million delinquent mortgages are heading towards foreclosure in 2012.
The states with the highest and lowest foreclosure rates in the nation in 2011.
States with HIGH foreclosure actions to housing units: Nevada 1/177, California 1/254, Arizona 1/357, Michigan 1/346, Florida 1/360, Georgia 1/381, Illinois 1/419.
States with LOW Foreclosure actions to housing units: North Dakota 1/316.000, Vermont 1/18.500, West Virginia 1/11.500, South Dakota 1/7.160, Arkansas 1/6.182, Wyoming 1/5.542.
FORECLOSURE STATISTICS - The Subprime Mortgage Crisis
After experiencing huge losses due to fallout from the subprime mortgage crisis, over 220 mortgage lenders have filed bankruptcy, gone out of business, or significantly reduced their lending policies, since 2006.
In December of 2007, foreclosure filings had jumped 97% compared to the previous year.
In 2007, more than 1% of all homes were in some stage of foreclosure, compared to only 0.58% in 2006.
A total of 224,451 foreclosure filings — default notices, auction sale notices and bank repossessions — were reported during October 2007. Up 2% from the previous month and up 94% from October 2006.
Florida had more than 2% of households entering some stage of the foreclosure process in 2007, 165,291 total properties.
The national foreclosure rate for October 2007 was 1 foreclosure filing for every 555 households.
Adjustable-rate subprime mortgages account for about 7% of all mortgages, but 42% of foreclosures.
Late payments rose to a 23-year high.
About $460 billion of adjustable-rate mortgages are scheduled to reset in 2008.
Another $420 billion will rise in the year 2011.
Between 750 thousand and 1 MILLION homes will be repossessed in 2008.
Foreclosure rate in October 2007 - Top 10 States
NEVADA - 1 foreclosure filing for every 154 households (6,732 foreclosure filings.)
CALIFORNIA - 1 foreclosure filing for every 258 households (50,401 filings.)
FLORIDA - 1 foreclosure filing for every 273 households (30,190 filings.)
OHIO - 1 in every 290 households (17,276 filings.)
GEORGIA - 1 foreclosure filing for every 332 households (11,352 filings.)
MICHIGAN - 1 foreclosure filing for every 334 households (13,415 filings.)
COLORADO - 1 foreclosure filing for every 382 households (5,379 filings.)
ARIZONA - 1 foreclosure filing for every 401 households (6,339 filings.)
INDIANA - 1 foreclosure filing for every 516 households (5,284 filings.)
ILLINOIS - 1 foreclosure filing for every 532 households (9,674 filings.)
Top metro foreclosure rates in October 2007
1 - Merced: one foreclosure filing for every 82 households — 6.7 times the national average.
2 - Stockton
3 - Modesto
4 - Las Vegas: one foreclosure filing for every 120 households.
5 - Detroit: one foreclosure filing for every 131 households.
6 - Riverside-San Bernardino
7 - Vallejo-Fairfield
8 - Cape Coral-Fort Myers, Fla.
9 - Sacramento
10 - Cleveland
2008 Pre-foreclosure Statistics - Top 15 States
FLORIDA
Households: 6,330,401
Jan: 36,640
Feb: 37,065
Mar: 43,782
Apr: 43,410
May: 42,353
Total Filings: 203,250
Percentage: 3.21 %
CALIFORNIA
Households: 11,502,870
Jan: 36,882
Feb: 36,093
Mar: 47,730
Apr: 39,338
May: 37,744
Total Filings: 197,787
Percentage: 1.72 %
ARIZONA
Households: 1,889,518
Jan: 11,839
Feb: 11,829
Mar: 13,596
Apr: 16,799
May: 13,897
Total Filings: 67,960
Percentage: 3.60 %
ILLINOIS
Households: 3,845,980
Jan: 8,857
Feb: 6,918
Mar: 9,923
Apr: 8,063
May: 7,217
Total Filings: 40,978
Percentage: 1.07 %
NEW JERSEY
Households: 3,064,645
Jan: 6,097
Feb: 6,902
Mar: 8,172
Apr: 8,327
May: 7,684
Total Filings: 37,182
Percentage: 1.21 %
TEXAS
Households: 5,271,150
Jan: 7,422
Feb: 6,240
Mar: 6,715
Apr: 7,162
May: 1,522
Total Filings: 29,061
Percentage: 0.55 %
NEVADA
Households: 742,752
Jan: 6,607
Feb: 4,610
Mar: 6,876
Apr: 5,177
May: 4,985
Total Filings: 28,255
Percentage: 3.80 %
GEORGIA
Households: 2,738,143
Jan: 4,769
Feb: 5,240
Mar: 5,459
Apr: 5,007
May: 5,120
Total Filings: 25,595
Percentage: 0.93 %
NEW YORK
Households: 4,775,152
Jan: 4,366
Feb: 4,948
Mar: 4,960
Apr: 3,462
May: 3,689
Total Filings: 21,425
Percentage: 0.45 %
COLORADO
Households: 1,593,732
Jan: 3,260
Feb: 3,928
Mar: 4,045
Apr: 3,287
May: 3,568
Total Filings: 18,088
Percentage: 1.13 %
MASSACHUSETTS
Households: 2,443,580
Jan: 4,354
Feb: 3,372
Mar: 4,125
Apr: 2,174
May: 3,173
Total Filings: 17,198
Percentage: 0.70 %
NORTH CAROLINA
Households: 2,683,848
Jan: 3,864
Feb: 3,685
Mar: 3,577
Apr: 3,265
May: 2,448
Total Filings: 16,839
Percentage: 0.63 %
MICHIGAN
Households: 2,657,945
Jan: 3,061
Feb: 3,293
Mar: 3,049
Apr: 1,350
May: 6,019
Total Filings: 16,772
Percentage: 0.63 %
VIRGINIA
Households: 2,453,033
Jan: 2,514
Feb: 2,588
Mar: 3,118
Apr: 4,070
May: 3,304
Total Filings: 15,594
Percentage: 0.64 %
MARYLAND
Households: 1,980,859
Jan: 3,022
Feb: 3,458
Mar: 3,688
Apr: 3,321
May: 859
Total Filings: 14,348
Percentage: 0.72 %
Return from foreclosure-statistics to Home page.
DISCLAIMER: The law will vary depending on your state, jurisdiction and the specifics of your case. The information provided by USAttorneyLegalServices.com is intended for educational purposes only. The content on this site should NOT be considered professional legal advice or a substitute for professional legal advice. For such services, we recommend getting a free initial consultation by a licensed Attorney in your state.


